


Abstract
We found evidence of late-onset Alzheimer disease (LOAD)-associated genetic polymorphism within an exon of Mucin 6 (MUC6) and immediately downstream from another gene: Adaptor Related Protein Complex 2 Subunit Alpha 2 (AP2A2). PCR analyses on genomic DNA samples confirmed that the size of the MUC6 variable number tandem repeat (VNTR) region was highly polymorphic. In a cohort of autopsied subjects with quantitative digital pathology data (n = 119), the size of the polymorphic region was associated with the severity of pTau pathology in neocortex. In a separate replication cohort of autopsied subjects (n = 173), more pTau pathology was again observed in subjects with longer VNTR regions (p = 0.031). Unlike MUC6, AP2A2 is highly expressed in human brain. AP2A2 expression was lower in a subset analysis of brain samples from persons with longer versus shorter VNTR regions (p = 0.014 normalizing with AP2B1 expression). Double-label immunofluorescence studies showed that AP2A2 protein often colocalized with neurofibrillary tangles in LOAD but was not colocalized with pTau proteinopathy in progressive supranuclear palsy, or with TDP-43 proteinopathy. In summary, polymorphism in a repeat-rich region near AP2A2 was associated with neocortical pTau proteinopathy (because of the unique repeats, prior genome-wide association studies were probably unable to detect this association), and AP2A2 was often colocalized with neurofibrillary tangles in LOAD.
INTRODUCTION
Late-onset Alzheimer disease (LOAD) is a devastating neurological condition with aspects of heritable risk that are incompletely understood (1–3). The gold standard endophenotypes for indicating the presence and severity of LOAD are the neuropathologic hallmarks: Amyloid-β (Aβ) plaques and neurofibrillary tangles (NFTs) composed of Tau proteins (4). In clinical-pathologic correlation and neuroimaging biomarker studies, the distribution of NFT/Tau proteinopathy in neocortical regions was strongly associated with cognitive impairment (5–7).
Single nucleotide polymorphisms (SNPs) in or near >20 different genes have been linked to LOAD risk (8–12). The APOE ε4 allele, a highly impactful genetic risk factor, was demonstrated to be associated with the LOAD phenotype by testing APOE alleles in relatively small groups: 95 LOAD cases were initially compared with 139 “unaffected” controls (13). Genome-wide association studies (GWAS) have been performed subsequently, with genotyping based on preselected SNP probes and imputing additional variants. Recent LOAD GWAS sample sizes were large, and imputation approaches have improved (10, 14, 15). These advances enabled the identification of many individual gene variants that have relatively subtle associations with LOAD risk, although collectively these SNPs may have large impact (16).
Unfortunately, the complexity of the human genome and shortcomings of extant sequence characterization methods are limiting factors, so that some genomic phenomena were not surveyed completely in prior studies. For example, rare gene variants were often ignored or removed from GWAS analyses because they were not imputed accurately (17–19). Many incompletely annotated genomic regions, and areas with repetitive sequences, were also trimmed off by software algorithms used to operationalize the GWAS data (20–22).
As may be expected because of the abovementioned limitations, a relatively large amount of genetic influence on LOAD risk is not explained by prior GWAS; hence, the so-called “missing heritability” problem (23–25). For example, heritability explained 79% of LOAD risk in a Swedish twin study (24), whereas common risk variants identified by GWAS explained only 20%–50% of total phenotypic variance of LOAD (23, 24). These and other data (26–28) indicated that a substantial proportion of LOAD-associated genetic risk factor(s) remain unidentified.
Recent advances in sequencing technologies have enabled more comprehensive genotype-phenotype association studies. For example, whole-exome sequencing (WES) data derive from polymerase chain reaction (PCR)-based reads in annotated exons. These data provide more accurate genotyping of rare variants and insertions/deletions (indels) in comparison to the preselected gene variant probes in most GWAS studies. For analyzing sequencing data, tailored computational methods such as the Sequence Kernel Association Test (SKAT) can be used to test for association between rare variants and a phenotype of interest (29). However, even in the high-quality Alzheimer’s Disease Sequencing Project (ADSP) WES data set (30, 31), many regions of the human genome were filtered out due to incomplete mapping, ambiguous reads, or imperfectly aligned data pipelines (22, 32).
In the present study, we analyzed ADSP WES data derived from over 10 000 individuals with the goal of identifying novel genetic variants associated with the LOAD phenotype. Preliminary results found evidence of LOAD-linked genetic variation within an exon of the Mucin 6 (MUC6) gene, and ∼4000 base pairs downstream from another gene that encodes Adaptor Related Protein Complex 2 Subunit Alpha 2 (AP2A2). The locus of interest was a poorly annotated region with unique tandem repeats, largely unreadable by existing sequencing methods. We performed additional studies including PCR-based characterization of the tandem repeat-containing region in a cohort of autopsied individuals. Those results were correlated with digitally operationalized LOAD pathologic endophenotypes, and augmented by immunohistochemical analyses from LOAD cases and non-AD control brains.
MATERIALS AND METHODS
Analyses of ADSP WES Data
ADSP (phs000572.v6.p4) was established to identify genomic variants associated with altered risk of developing the LOAD phenotype (https://www.niagads.org/adsp/content/home). Data were gathered from the Alzheimer’s Disease Genetic Consortium (ADGC), comprising 18 cohorts, and Cohorts for Heart and Aging Research in Genomic Epidemiology (CHARGE) Consortium, comprising 6 cohorts (12, 33, 34) (Supplementary Data Table S1). ADSP generated WES data for 10 913 unrelated subjects with the following features: (1) paired-end reads were mapped to the GRCh37 human reference genome in Binary Alignment Map (BAM) files at 3 Large Scale Sequencing/Analysis Centers—the Human Genome Sequencing Center at Baylor College of Medicine (BAYLOR), Broad Institute Genome Center (BROAD), and Genome Institute at Washington University; (2) genotypes were called by BAYLOR and BROAD, generating project-level Variant Call Format (VCF) files; and, (3) quality control and concordance checks were combined and made available in a single VCF file. Subjects with diagnostic data who were ≥65 years of age at the last visit or at death (n = 10 468) were included in a principal component analysis (PCA) to identify ethnic outliers. PCA was performed in PLINK v1.90a (35, 36) using a linkage disequilibrium (LD) pruned subset of markers (pairwise r 2 < 0.2) from these data and 1000 Genomes Project Phase 3 (1000 Genomes) (37) data after removing symmetric SNPs and flipping SNPs discordant for DNA strands between ADSP WES and 1000 Genomes data. First and second PCs were plotted for each individual (n = 10 468 from ADSP WES and n = 2504 from 1000 Genomes). Based on the PCA, 437 subjects were removed as ethnic outliers, yielding n = 10 031 (5142 AD cases and 4889 controls) of European ancestry (Supplementary Data Figs. S1 and S2). The disease phenotyping was based on clinical criteria: AD cases were determined by National Institute of Neurological and Communicative Disorders and Stroke, and the Alzheimer’s Disease and Related Disorders Association (NINCDS-ADRDA) clinical criteria for possible, probable, or definite AD (38), and controls were free of dementia by direct, documented cognitive assessment (30, 39).
WES data contained biallelic indels (n = 49 244) and single nucleotide variants (SNVs) (n = 1 586 687) genotypes, generated by applying a quality control protocol designed by the ADSP Quality Control Working Group (https://www.niagads.org/adsp/content/sequencing-pipelines). All variants were in Hardy-Weinberg equilibrium (cut-off p value 1 × 10⁻⁵). Consensus VCF files for SNVs contained variant level-filtering results for both the BROAD and BAYLOR pipelines (Supplementary Data Table S2).
We examined the associations between genetic variants and the AD phenotype in ADSP WES data. For these analyses, we used optimal unified sequence kernel association test (SKAT-O) in the “SKAT” R package version 1.3.2.1 (29, 40, 41), which was designed to test mixed positive and negative rare variant effects on phenotype (41). The start and end gene positions for canonical transcripts, defined as either the longest coding sequence or the longest cDNA in the GRCh37 hg19 assembly (from the Genome Reference Consortium), were obtained in the UCSC Genome Browser (https://genome.ucsc.edu/) (42). To identify single rare variants associated with AD within MUC6, Fisher’s exact test was implemented in PLINK v1.90a (35, 36). Additive mode of inheritance was assumed, and a rare variant was defined according to a minor allele frequency threshold of <0.05. Recombination rates for an association plot within the AP2A2 and MUC6 regions were obtained from LocusZoom software (43).
TaqMan SNP Genotyping for rs202193006 in a Subsample of Subjects in the ADSP Data Who Were Also in the University of Kentucky Alzheimer’s Disease Center Autopsy Cohort
The SNP rs202193006 on MUC6, which was associated with LOAD status in the single variant analysis, was directly evaluated using DNA isolated from a convenience subsample of research volunteers whose data were represented in both the University of Kentucky Alzheimer’s Disease Center (UK-ADC) autopsy cohort and also from the ADSP WES data set. The sole basis of choosing these 7 cases in this analysis was the availability of their DNA for our direct genotyping, as well as their WES data being available from ADSP, so that the 2 results could be compared. A custom PCR-based TaqMan SNP genotyping assay (Applied Biosystems, Foster City, CA) was developed to directly test rs202193006 SNP status. The assay consisted of 2 sequence-specific PCR primers and 2 TaqMan minor groove binder (MGB) probes with nonfluorescent quenchers (NFQ). One of the probes was labeled with VIC dye to detect Allele 1 (“G”-Allele) sequence; the second probe was labeled with FAM dye to detect Allele 2 (“A”-Allele) sequence. Ten (10) nanograms of each isolated genomic DNA were mixed with TaqMan-rs202193006 assay and TaqMan Genotyping Master Mix (Cat no. 4371353, Applied Biosystems) following manufacturer’s instructions. The PCR was carried out on a ViiA 7 machine (Life Techonologies, Carlsbad, CA). The post-PCR plate read and analyses were performed using QuantStudio Real-time PCR software (Life Technologies). Automatic allele calls were first used for the allelic discrimination and further verified manually.
Pathological Staining Methods and Analyses
Details of the UK-ADC research volunteers’ recruitment, the overall cohort inclusion/exclusion criteria, and clinical assessments were described previously (44, 45). Briefly, older adult volunteers agreed to be followed annually for cognitive, physical, and neurological examination and to donate their brain at the time of death, with a provision to allow genetic testing for research purposes. Protocols and informed consent procedures were approved by the University of Kentucky Institutional Review Board. Brains with neuropathologically diagnosed rare conditions (e.g., prion disease) were excluded. Details of sampling and neuropathologic assessments in the UK-ADC autopsy cohort were described previously (46). Briefly, tissue was fixed in 10% formalin, processed in paraffin blocks, and sections were cut at 8 micron thickness. Immunohistochemical stains for phosphorylated Tau (pTau, detected using the PHF1 clone, a gift from Dr Peter Davies), Aβ peptide (Nab228, a gift from Dr Edward Lee) and phospho-TDP-43 (1D3 clone, EMD Millipore, Burlington, MA, 1:500 dilution) were performed as described previously (47). For AP2A2 immunohistochemistry, rabbit anti-AP2A2 (Cat no. LC-C482433/126430, LSBio, Seattle, WA, 1:1000 dilution) was used, and manufacturer’s recommendations were followed for light microscopic immunohistochemistry. The manufacturer’s website stated that the rabbit antiserum was raised against full-length recombinant AP2A2, was immunoaffinity purified, and was validated for both immunohistochemistry and Western blots.
For digital quantification of LOAD neuropathologic changes, immunostained slides were loaded into an Aperio (now Leica) ScanScope XT. Slides were scanned at 40× magnification, the data were stored on a dedicated server, and analyses were performed as previously described in detail (48). Sections were analyzed from the following left hemisphere neocortical regions: middle frontal gyrus (Brodmann area 9), superior and middle temporal gyri (Brodmann areas 21 and 22), inferior parietal lobule (Brodmann areas 39 and 40), and occipital lobe including the primary visual area (Brodmann areas 17 and 18). For both the Aβ and pTau digital quantification analyses, measurements of lesion burden were generated representing the proportion of brain areas occupied by lesion-defining immunoreactivity. The methodologies, algorithm inputs, and thresholding parameters were applied as previously reported in detail (48). Briefly, for digital evaluation of Aβ burden, the Aperio Image Analysis Toolbox Positive Pixel Count (PPC), version 9.1, was used. The PPC algorithm was run on ten 4-mm2 boxes selected on gray matter portions from each slide. For pTau proteinopathy, the pTau pathologic burden was also determined using a PPC algorithm, version 9.1, and the modified PPC algorithm run on ten 4-mm2 boxes placed in gray matter.
Characterizing the Size of the MUC6 Variable Number Tandem Repeat Region in Genomic DNA of Autopsied Participants
Genomic DNA from research volunteers was isolated from snap-frozen cerebellum, using Quick-DNA Miniprep Plus kits (Zymo Research, Irvine, CA) or QIAamp DNA kits (Qiagen, Hilden, Germany), or from frozen buffy coat samples using Quick DNA 96 Plus kits (Zymo Research). DNA quantitation and purity evaluation were performed using NanoDrop (ND-1000) Spectrophotometer (NanoDrop Technologies, Wilmington, DE). DNA samples with A260/A280 or A260/A230 ratios <1.8 were discarded or re-extracted.
Genomic DNA PCR amplification was performed using the Expand Long Range kit for large-amplicon PCR (Roche, Basel, Switzerland), with primers M612-F1 (CAGGTGAGATGGAGACAATGG) and M612-R1 (TGGTTGCAGAACTCAAGTGG) that are specific for unique sequences near the 5′ and 3′ ends of the MUC6 variable number tandem repeat (VNTR) region, with the amplicon spanning an exon/intron junction. Following PCR and agarose gel electrophoresis, the gel results were documented using FluorChem R system (ProteinSimple, San Jose, CA). For the Discovery cohort, a convenience sample (n = 119 subjects) was used based on the ready availability of DNA and digital neuropathology data. In this sample, the sizes of the PCR amplicon bands were measured with an automated method: Digitized gel images were analyzed using the AlphaView software (ProteinSimple), with the 1 kb ladder (New England Biolabs, Ipswich, MA) as a standard. The PCR procedures and amplicon size measurements were performed blind to any other information about the research volunteers. For the Replication cohort, a separate convenience sample was assessed (n = 173 subjects), roughly matching the Discovery cohort in age at death, sex, and cognitive status. For these cases, new DNA and/or digital neuropathologic evaluations were performed, and a slightly different PCR procedure was used (Supplementary Data Fig. S3).
To verify that the PCR amplicons contained sequences from exon 31 of MUC6, additional PCRs were performed on a subset of genomic DNA samples using separate nested primers (Supplementary Data Fig. S4). Further, direct sequencing was performed on a subsample of restriction digested amplicons. For direct sequencing, genomic DNA from 2 subjects was subjected to PCR using primers M612-F1_EcoR1 (M612-F1 primer with an EcoR1 restriction site attached to the 5′ end) and M612-R1, and digested with EcoR1 and Sal1. Following separation on an 0.8% E-Gel agarose gel (Invitrogen), the EcoR1/Sal1 fragments were extracted using the Zymoclean Gel DNA Recovery Kit (Zymo Research), ligated into pBluescript SK vector predigested with EcoR1 and Sal1, and transformed into E. coli NB cells (Novagen). Plasmids were isolated using ZR Plasmid Miniprep-Classic kit (Zymo Research) and sequenced in a commercial facility (Eurofins Genomics, Luxembourg) using T3 and T7 primers. Sequences were analyzed using CLC Main Workbench software (Qiagen).
Statistical Analyses for the Association Between PCR Amplicon Size and AD-Type Neuropathology—Aβ and pTau
With the goal of comparing AD-type pathologic severity in groups of subjects stratified by having larger, versus smaller, MUC6 VNTR regions, we applied analysis of covariance (ANCOVA) with inverse-variance weights involving a response variable of Aβ amyloid or pTau burden and an explanatory variable of the larger MUC6 VNTR PCR amplicon size. To achieve normal distribution, the data of immunohistochemically detected Aβ burden were square-root-transformed and the data of pTau burden were log-transformed. The MUC6 VNTR PCR amplicon size was dichotomized at the 25, 33.3, 50, 66.6, and 75 percentiles to find an appropriate cutoff value for analyzing a replication cohort. Age at death, sex, and APOE ε4 dosage (0, 1, or 2 copies of the ε4 allele) were added as covariates in the models. The Replication cohort testing was done in the same manner but focusing specifically on the results for pTau pathologic burden detected in the superior and middle temporal neocortex.
Assessment of Human Tissue AP2A2 and MUC6 Transcript Levels
Human tissue AP2A2 and MUC6 transcript expression data were obtained on May 3, 2019, via the public access Genotype-Tissue Expression (GTEx) Portal (https://gtexportal.org/home/gene/AP2A2 and https://gtexportal.org/home/gene/MUC6) (49).
Immunofluorescence—Double-Label Epifluorescence and Confocal Microscopy
Double-label immunofluorescence experiments were performed using methods previously described (47), with some modifications. Sections were cut from formalin-fixed, paraffin-embedded tissue blocks at 8 micron thickness, and deparaffinized prior to microwave antigen retrieval for 6 minutes (power 8) using citrate buffer (pH6, Declere buffer, Cell Marque, Rocklin, CA). The mounted sections were placed in 100% formic acid (Thermo Fisher, Waltham, MA) for 3 minutes. Sections were next incubated for 45 seconds at room temperature in a 1× solution of TrueBlack (Cat no. 23007, Biotium, Fremont, CA) prepared in 70% ethanol, to reduce auto-fluorescence. Sections were blocked in 5% normal goat serum in TRIS-buffered saline (5% S+TBS) for 1 hour at room temperature, then incubated in both primary antibodies anti-AP2A2 (rabbit polyclonal, 1:100 dilution; Cat no. LC-C482433/126430, Lifespan Biosciences) and PHF1 (mouse monoclonal, 1:500 dilution, gift from Dr Peter Davies), diluted in 5% S+TBS, for 22 hours at 4 °C. After washing (x4), sections were incubated in secondary antibodies conjugated to Alexa Fluor probes 594 and 488 (Cat nos A11032 and A11034, Life Technologies) diluted 1:200 in 5% S+TBS for 1 hour at room temperature. Slides were coverslipped using Invitrogen ProLong Gold mounting medium with DAPI (Cat no. P36935, Thermo Fisher). Separate controls were run lacking either PHF1 or AP2A2 antibodies, and these single-primary controls were run with both secondary antibodies (all antibodies at same concentrations, all other steps the same), to ensure that neither autofluorescence nor antibody cross-reaction were leading to false-positive colocalization.
For epifluorescence images, microscope slides were scanned and digitized using a Zeiss AxioScan.Z1 slide scanning microscope at 40× magnification (Plan-Apochromat 40×/0.95), using the same imaging profile (LED light intensity, exposure, and filter sets). The slides were viewed and analyzed using HALO image analysis software (Indica Labs, Albuquerque, NM; version 2.3). HALO software was used to draw regions of interest (ROI) for the 7 anatomical areas included in this study. The average ROI area was 3.8 mm2, with a minimum ROI of 0.8 mm2, and maximum ROI of 12.3 mm2. The area quantification FL module (Indica Labs; version 1.2) was used to quantify the area of staining and the area of colocalized staining. Adjacent serially sectioned slides stained with a single antibody were used as controls to set the thresholds for the positive immunostained area. Quantification utilized batch processing with the same settings for all slides. The computer-generated markup was inspected to ensure that the software was accurately quantifying positive staining and not background or artifact. To quantify the compact, brightly AP2A2 immunopositive structures that appeared to be inclusions, the cytonuclear FL module (Indica Labs; version 1.4) was used. Settings in the module were adjusted for size and threshold intensity to count the number of small bright inclusions, while not detecting cytoplasmic AP2A2 staining. To query the specificity of the findings in LOAD cases, additional immunohistochemical staining was performed in a convenience sample of 4 cases with autopsy-confirmed progressive supranuclear palsy (PSP; staining was performed in caudate nucleus), and a separate group of 5 brain sections with limbic-predominant age-related TDP-43 encephalopathy neuropathologic changes (LATE-NC [50]). Analyses were performed on phospho-TDP-43 immunostaining in CA1 and subiculum.
A subset of slides were imaged on a Nikon C1 confocal microscope at 40× magnification using the following settings: (1) 2048 × 2048 pixel dimension; (2) 1.2 ms dwell time; (3) full scan area; (4) z-step size of 0.175 μm; (5) 10 μm z-range; and, (6) channel series. Nonoverlapping z-stacks (5–10) were captured in the CA1/subiculum region, and in the neocortex within gray matter areas with AP2A2 and pTau staining. The resulting image files were viewed in the Imaris imaging software (Bitplane; Zurich, Switzerland; Version 9.1). An individual blind to the experimental conditions counted the number of AP2A2, pTau, and double positive cells in each of the z-stacks.
Cell Culture Experiments to Test Tau-AP2A2 Coimmunoprecipitation
HeLa cells were grown as previously described in 6-well plates (51). The following plasmids were used for transfections: pCMV6-XL5 empty vector; pCMV6-XL5-MYC/DDK [Flag-tag]-AP2A2, and pCMV6-XL5 -Tau (no tag)—all from Origene (Rockville, MD). According the manufacturer, the Tau plasmid expressed a transcript referent to accession number NM_005910, with an open reading frame of 1323 bp. Transfections were performed using Lipofectamine 3000 (Thermo Fisher) according to manufacturer’s protocol, using 3.0 μg total plasmid in each well (Supplementary Data Table S3). Each transfection was performed with 2 biological replicates. The cells were harvested 28 hours after transfection. Cell lysis, immunoprecipitation, and Western-blot analysis procedures were performed following our previously described protocols (52, 53). Briefly, cells were lysed in a buffer containing 25 mM Tris-HCl, 150 mM NaCl, 0.5% Triton X-100, 0.5% NP-40, pH 8.0, and protease inhibitors (Promega, Madison, WI) for 30 minutes on ice, followed by a quick centrifugation to remove the insoluble cell debris. The supernatant was transferred to a clean tube and an aliquot saved as total lysate for Western-blot analysis. The remaining lysate was divided equally into 2 tubes and was incubated with either Anti-Flag M2 affinity gel (Sigma, St. Louis, MO), or nonimmunized mouse serum (NMS) for 4 hours at 4 °C. Following incubation, the beads were rinsed 4 times in the same lysis buffer and the bound proteins were eluted by heating the beads in SDS Laemmli sample buffer at 95 °C for 6 minutes. For Western blots, lysates and immunoprecipitation products were separated using 10% SDS-polyacrylamide gel electrophoresis and transblotted onto a nitrocellulose membrane for immunoblotting. Following blocking with 5% skim milk, the blots were incubated with primary antibodies overnight, and washed 4 times in phosphate-buffered saline with Triton X-100 at 0.05% (PBS/T) for 10 minutes prior to incubation with respective horseradish peroxidase-conjugated secondary antibodies (Jackson ImmunoResearch Laboratories, West Grove, PA, diluted at 1:20 000) for 1 hour. The chemiluminescent signals on the blots were visualized with Pierce ECL Western Blotting Substrate (Thermo Fisher). The primary antibodies used in this work were anti-AP2A2 (Cat no. LC-C482433/126430, Lifespan Biosciences, 1:1000 dilution), anti-AP2B1 (Cat no. 15690-1-AP, Proteintech, Rosemont, IL, 1:1000 dilution), anti-Tau (DA9, a gift from Dr Virginia Lee and produced originally by Dr Peter Davies, 1:1000 dilution), and anti-α-Tubulin (TU-01, Cat no.: ab7750, Abcam, 1:100 dilution).
Real-Time-qPCR Analysis of Human Brain Samples to Test If the VNTR Polymorphism Is an Expression Quantitative Trait Locus for AP2A2
Two subsample groups for comparison’s sake were based on the size of the largest measured PCR amplicon band—1 group with relatively large (≥10.8 kb) and 1 group with relatively small (≤10.1 kb) VNTR regions. The 2 groups (n = 15 in each) were matched on age at death, sex, postmortem interval, and AD pathologic severity. RNA from the cerebellum was analyzed since the cerebellum is the region with the human brain’s highest AP2A2 expression (Supplementary Data Fig. S5) and we hypothesized that this tissue would be relatively unaffected by age-related neurodegenerative processes. The tissue had been snap-frozen in liquid nitrogen at the time of autopsy and thereafter stored in −80 °C freezers; subsequent steps were performed blind to any clinical, pathological, or genetic information. The detailed methods for RNA isolation were described previously (54). Briefly, dissected tissue (mostly gray matter, ∼50 mg) from cerebellar lateral folia was used for RNA isolation. The brain tissue was homogenized in ice-cold RIPA buffer (Pierce, Waltham, MA) using a Dounce homogenizer. Trizol LS (Thermo Fisher) was used for total RNA isolation following the manufacturer’s instructions except that RNA precipitation was overnight at −20 °C as described (54). The quantity and purity of the RNA were estimated using a Nanodrop Spectrophotometer. An equal amount (1 μg) of total RNA from each sample was reverse-transcribed using the SuperScript III First-Strand Synthesis System (Thermo Fisher) following the manufacturer’s instructions. The cDNAs served as templates for quantitative PCR using the following TaqMan assays: AP2A2 (assay ID: Hs00392195_m1), AP2B1 (assay ID: Hs01079763_g1), GAPDH (assay ID: Hs02786624_g1), and RPL30 (assay ID: Hs00265497_m1). The Real-Time-qPCR reactions were carried out using ViiA7 System, and data were processed using QuantStudio Real-Time PCR software v1.3.
RESULTS
An overview of work in the present study is shown in Figure 1.
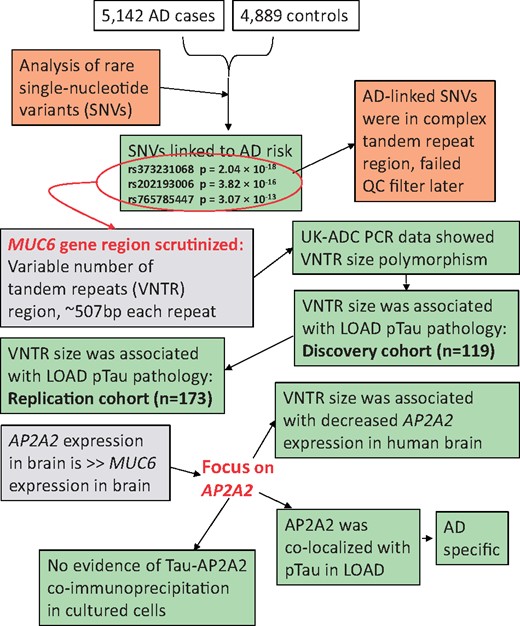
Overview of work in the present study. The study began with an analysis of whole-exome sequencing (WES) data comparing rare genetic variant frequencies between late-onset Alzheimer’s disease (LOAD) cases and non-AD controls. Subsequent analyses focused on the MUC6 variable number of tandem repeat (VNTR) region. The particular variants identified initially to be associated with LOAD risk were later removed from the consensus variant calls, presumably because this VNTR region is extremely challenging for high-throughput sequence characterization methods. Polymorphism in the MUC6 VNTR region was associated with phospho-tau (pTau) pathology and with altered AP2A2 expression. Immunohistochemical analyses showed that AP2A2 protein was often colocalized with pTau tangles in LOAD brains. Green boxes indicate new data and analytic results.
Analyses of WES Rare Variant Associations With LOAD
In our initial attempt to identify rare variants associated with LOAD using SKAT-O, MUC6 was the gene most strongly associated with LOAD status in ADSP WES data, yielding a gene-based association p value of 1.38 × 10⁻²⁶ (Supplementary Data Fig. S6). This association was driven by both positively and negatively associated variants located in exon 31 of MUC6 (rs373231068: position = 1 016 889 and p = 2.04 × 10⁻¹⁸, rs202193006: position = 1 018 348 and p = 3.82 × 10⁻¹⁶, and rs765785447: position = 1 018 379 and p = 3.07 × 10⁻¹³) as shown in Figure 2. However, the specific individual MUC6 genetic variants associated with LOAD risk did not pass the BAYLOR quality control filter. Notably, these individual MUC6 SNV calls were within a region with complex tandem repeated sequences. Those tandem repeat motifs appear to have produced low mapping quality scores and a commensurate high percentage of SNVs that failed to pass the quality control software filters (Supplementary Data Fig. S7). For chromosome 11, 89% of SNVs passed BROAD and BAYLOR filters, and 11% failed to pass one or other filter; by contrast, within exon 31 of MUC6, only 37% of SNVs passed both filters (Supplementary Data Fig. S7A). Correspondingly, many reads that were aligned to exon 31 of MUC6 had low mapping quality (Supplementary Data Fig. S7B ).
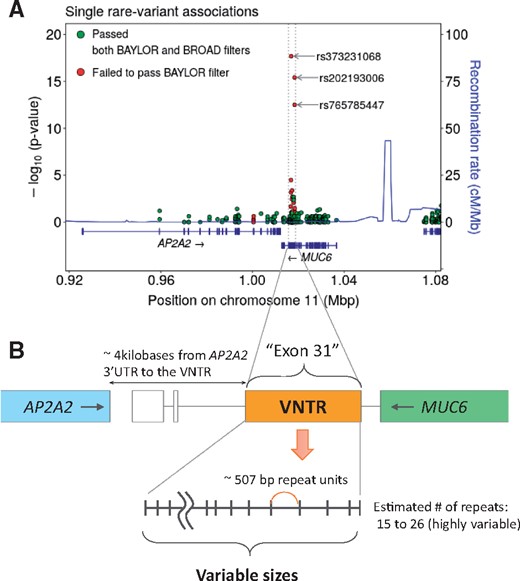
Plot of rare variant analysis in Alzheimer’s Disease Sequencing Project (ADSP) whole-exome sequencing (WES) data, indicating genetic variants associated with late-onset Alzheimer disease (LOAD) risk in the MUC6 variable number of tandem repeats (VNTR) region. (A) p Values are shown from single rare variant analyses in terms of association with LOAD phenotype. Several genetic variants were initially reported to be associated with LOAD risk at p < 1 × 10⁻¹⁰ (red circles). These specific genetic variant calls later failed quality control when different data quality filters were applied. (B) Panel depicts this genomic region in schematic form. The initial genetic variants were present in a unique, exonic, and polymorphic VNTR region that is annotated inside the MUC6 gene and within 4000 bases of the 3′-untranslated region (UTR) of the AP2A2 gene. Whereas these specific SNP calls in the MUC6 VNTR region were the initial reason for studying this genetic locus, the subsequent experiments focused on the polymorphic size of the VNTR region and the association with pTau proteinopathy.
TaqMan SNP Genotyping for rs202193006 in the MUC6 VNTR Region in a Subsample of UK-ADC Cohort Subjects Whose DNA Was Also Sequenced in the ADSP Data Set
A custom PCR-based TaqMan SNP genotyping assay was used to directly test rs202193006 SNP status in a convenience subsample of 7 UK-ADC subjects. This was one of the SNPs linked to LOAD risk in our primary analyses (Fig. 2). Based on the ADSP WES data, out of the 7 subjects, 4 were initially called heterozygous (G/A) and 3 were called homozygous for the major allele (G/G). However, when we directly sequenced the same persons’ genomic DNA using a TaqMan PCR-based assay, all 7 samples were homozygous for the G/G allele. We hypothesized that the ADSP genotyping results, in the complex MUC6 VNTR region that failed the BAYLOR filter, may have been a proxy for a different genetic phenomenon.
Long-Range PCR of the MUC6 VNTR Region, Restriction Digestion, Cloning, and Sequencing
Toward testing the hypothesis that the initial WES genotype calls were a proxy for polymorphism in the MUC6 VNTR region, PCR was performed on genomic DNA using primers that spanned the MUC6 VNTR region. The resulting amplicons showed evidence of considerable polymorphism both between and within individuals (there were many heterozygotes) in terms of the VNTR region length. All of the amplicons in the Discovery cohort were measured (blind to other data) with an automated software tool. A representative agarose gel image is shown in Figure 3, along with a histogram plot of the detected amplicon sizes. No particular amplicon size occurred in >25% of subjects, which underscores the high degree of polymorphism in these cohorts. To verify that the PCR amplicons represented the MUC6 VNTR region, 2 different experiments were performed. First, we used an independent set of nested MUC6 VNTR region primers which showed that the amplicon sizes were the same, using different primers, in specific subjects’ DNA (Supplementary Data Fig. S4). Second, portions of the amplicons from 2 individuals’ DNA with differing amplicon banding patterns were digested using restriction enzymes, cloned into plasmids, and sequenced. The restriction enzyme digested DNA fragments were the predicted sizes given the known location of the restriction sites (Supplementary Data Fig. S8), and the sequences of the cloned fragments were exactly as predicted within the annotated 5′ portion of the VNTR region (sequences are shown in Supplementary Data Fig. S9).
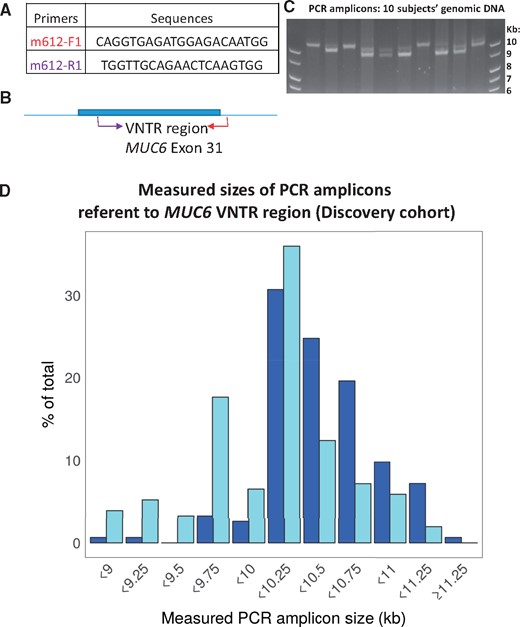
PCR assays were performed on genomic DNA isolated from autopsied subjects in order to measure the size of the MUC6 VNTR region. (A) PCR primers were used that flanked the VNTR region and spanned an exon/intron junction in exon 31 of the MUC6 gene, as depicted in panel (B). (C) Panel shows an agarose gel with a subsample of representative amplicons using genomic DNA from 10 separate individuals, to convey the heterogeneity in the primary data. Note that there are either 1 or 2 bands, presumably representing homozygotes and heterozygotes, respectively. The sizes of the amplicons were measured using an automated method. (D) A chart of the measured sizes (in kilobases) of the PCR amplicons for all the Discovery cohort (n = 119) subjects is shown. The larger (top) PCR amplicons on the gel are represented in this histogram in darker blue bars, the smaller (bottom) amplicons represented as pale blue bars. Note the large degree of variation among the sizes of the amplicons, indicating extensive polymorphism in the MUC6 VNTR region size.
Testing the Association Between MUC6 VNTR Region Size and AD-Type Neuropathology
We hypothesized that, as in other neurologic conditions associated with tandem repeat polymorphism (55), the larger tandem repeat haplotype would be the one associated with the disease phenotype—in this case, LOAD pathologic changes. Thus, we tested whether the size of the largest VNTR region (i.e., the top band measured on the agarose gels) would be associated with more severe Aβ plaques and/or pTau pathology. The PCR results were correlated with quantitative metrics for Aβ plaque burden and pTau burden that were generated using immunohistochemical stains and digital pathologic measurements in 6 and 8 different brain regions for Aβ plaques and pTau pathology, respectively, from 119 autopsied individuals (as the Discovery cohort). These neuropathologic metrics were obtained, on a routine and ongoing basis, for subjects who had come to autopsy in the UK-ADC autopsy cohort (Fig. 4). As the Replication cohort, we assessed a nonoverlapping convenience sample comprising DNA analyses and the temporal neocortex pTau pathologic burden for 173 separate autopsied subjects. This brain area was chosen for the replication experiments, because it was the brain region with the nominally lowest p value according to the comparisons in the Discovery cohort. Various characteristics of both the Discovery and Replication cohorts are shown in Table 1.
Summary Information About Subjects Included in the Discovery Cohort (n = 119) and the Replication Cohort (n = 173) With MUC6 VNTR Size Analyses and Neuropathologic Studies From the University of Kentucky AD Center (UK-ADC)
| Variables | Discovery Cohort (n = 119) | Replication Cohort (n = 173) |
|---|---|---|
| Age at death in years, mean±SD (range) | 83.5±9.2 (58–103) | 83.8±8.3 (57–105) |
| Female, n (%) | 67 (56.3) | 103 (59.5) |
| Cognitive status documented before death | ||
| MMSE score at the last visit, mean±SD (range) | 19.9±9.6 (0–30) | 20.0±9.4 (0–30) |
| Clinical diagnosis at the last visit, n (%) | ||
| Normal cognition | 29 (24.6) | 34 (19.8) |
| Mild cognitive impairment | 13 (11.0) | 21 (12.2) |
| Demented | 71 (60.2) | 109 (63.4) |
| Impaired (not MCI) or other/missing | 5 (4.2) | 8 (4.6) |
| Neuropathologic changes, n (%) | ||
| Advanced Alzheimer disease (Braak NFT stages V or VI) | 56 (49.6) | 106 (61.3) |
| Limbic-predominant age-related TDP-43 encephalopathy (Stage>0) | 40 (33.9) | 33 (19.2) |
| Neocortical Lewy body pathology (any) | 18 (15.1) | 28 (16.2) |
SD, standard deviation; MMSE, Mini-Mental State Examination; MCI, mild cognitive impairment; NFT, neurofibrillary tangle.
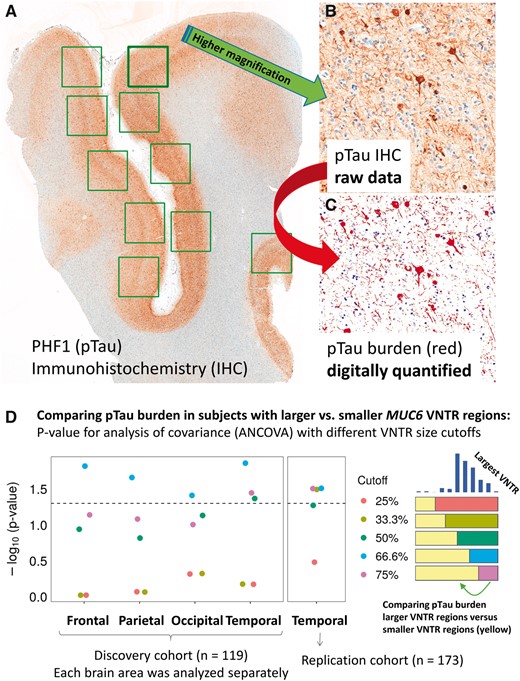
Digital quantification of Alzheimer disease (AD) pTau pathologic burden, for correlation with the size of the MUC6 VNTR polymorphism in 119 subjects (Discovery cohort) followed by additional analyses of 173 separate subjects (Replication cohort). (A–C) Panels show representative results of pTau immunohistochemistry (IHC) from the superior and middle temporal gyri (Brodmann areas 21/22) of a person who died with severe dementia. The primary pTau immunostain is shown in panel (A), and at higher magnification in panel (B). The false-colored data shown in panel (C) conveys what was detected by the software and quantified to provide an assessment of pTau burden in each section. These parameters from different brain regions, among individuals in the University of Kentucky AD Center autopsy cohort (Table 1), were analyzed to compare the amount of pTau burden in subjects stratified by the size of the largest detected MUC6 VNTR region according to the PCR assay. (D) p Values (y axis as -log10 scale) from analysis of covariance (ANCOVA) tests, applying different VNTR size cutoffs for the comparisons, and correcting for APOE genotype, age at death, and sex. Each brain region in the Discovery cohort was analyzed separately, but the results were notably consistent. The dashed line indicates a p value of 0.05. The results with lowest p values were in the comparisons wherein pTau burdens were compared between subjects with the largest 33.3%ile (tertile) MUC6 VNTRs versus the other samples. See Table 2 for more detailed analyses of results for these and other parameters. Scale bars: A = 3 mm; B, C = 100 microns.
Figure 4D shows a chart with p values from ANCOVA with each of the cutoff values (25, 33.3, 50, 66.6, and 75 percentiles), used for comparing pTau burden between groups dichotomized according to having larger and smaller MUC6 VNTR regions. The subjects with larger VNTR regions had significantly more pTau burden in neocortical regions and entorhinal cortex than those with smaller VNTR region size. Based on these results from the Discovery cohort, the 66.6 percentile (top tertile) cutoff value most consistently showed difference in pTau severity in neocortical regions, with the temporal neocortex showing the biggest difference. This association in temporal cortex region was replicated in a separate sample (Table 2), with no other areas or pathologic correlations being tested in the replication analyses. All statistical comparisons applied 2-tailed tests. For comparison, the associations between APOE ε4 dosage and pTau or Aβ burden are also provided (Table 2). We emphasize that every slide in each region was analyzed independently. Note that even with these relatively small sample sizes, the associations between neocortical pTau burden and larger VNTR size were statistically significant. In contrast to the associations between VNTR region size and pTau in the neocortical regions, Aβ burden was not statistically significantly associated with VNTR size (Table 2).
Associations* of Pathologic Burden (pTau Burden and Aβ amyloid Burden), Comparing Subjects With Larger MUC6 VNTR Regions Versus Subjects With Smaller MUC6 VNTR Regions in the Discovery Cohort (n = 119) and the Replication Cohort (n = 173)
| MUC6 VNTR Region Size (Top Tertile vs Lower 2 Tertiles) | APOE ɛ4 Dosage | |||||||||||
|---|---|---|---|---|---|---|---|---|---|---|---|---|
| pTau | Aβ | pTau | Aβ | |||||||||
| † | SE | p value‡ | † | SE | p value‡ | † | SE | p value | † | SE | p value | |
| Discovery cohort (n=119)§ | ||||||||||||
| Neocortical regions | ||||||||||||
| Frontal | 0.90 | 0.37 | 0.015 | 0.79 | 0.77 | 0.31 | 0.18 | 0.28 | 0.52 | 1.30 | 0.63 | 0.040 |
| Parietal | 0.88 | 0.38 | 0.022 | 0.86 | 0.74 | 0.25 | 0.45 | 0.29 | 0.13 | 1.45 | 0.61 | 0.019 |
| Occipital | 0.77 | 0.37 | 0.039 | 0.99 | 0.54 | 0.071 | 0.76 | 0.29 | 0.0093 | 1.56 | 0.44 | 5.4×10⁻⁴ |
| Temporal | 0.94 | 0.37 | 0.014 | 1.17 | 0.63 | 0.064 | 0.61 | 0.29 | 0.036 | 1.52 | 0.52 | 0.0042 |
| Mediotemporal lobe regions | ||||||||||||
| Amygdala | 0.37 | 0.26 | 0.16 | ¶ | ¶ | ¶ | 0.57 | 0.21 | 0.0092 | ¶ | ¶ | ¶ |
| Hipp/CA1 | 0.52 | 0.29 | 0.074 | 0.79 | 0.40 | 0.052 | 0.80 | 0.24 | 0.0010 | 1.02 | 0.34 | 0.0029 |
| Entorhinal | 0.39 | 0.19 | 0.038 | ¶ | ¶ | ¶ | 0.24 | 0.15 | 0.12 | ¶ | ¶ | ¶ |
| Subiculum | 0.41 | 0.31 | 0.18 | 0.57 | 0.46 | 0.22 | 0.80 | 0.25 | 0.0015 | 0.98 | 0.37 | 0.0087 |
| Replication cohort (n=173) | ||||||||||||
| Temporal neocortex | 0.61 | 0.28 | 0.031 | ¶ | ¶ | ¶ | 1.10 | 0.25 | 2.4×10⁻⁵ | ¶ | ¶ | ¶ |
Results for APOE ɛ4 dosage in the same subjects and brain regions are provided for comparison’s sake.
pTau, phospho-Tau; SE, standard error; Temporal, superior and middle temporal neocortex, Brodmann areas 21/22.
Analysis of covariance (ANCOVA) comparing Aβ and pTau pathologic burdens between subjects with VNTR regions in the upper tertile (top 33%) versus the other subjects. All tests were 2-tailed. Bolded p values are p < 0.05.
β estimate for the log-transformed pTau and square-root-transformed Aβ pathologic burdens.
p value for amplicon size comparison is adjusted for age, sex, and APOE ɛ4 dosage (0, 1, or 2 copies of the ɛ4 allele).
All brain regions were analyzed separately for each region and each case.
Digital neuropathologic data were not gathered.
Testing If the MUC6 VNTR Polymorphism Was Associated With Brain AP2A2 Expression Variability
The MUC6 VNTR is in close proximity to the AP2A2 gene on Chr. 11p (Fig. 2B). AP2A2 is also expressed at far higher levels than MUC6 in the human brain (Supplementary Data Fig. S5). For these reasons, we hypothesized that the VNTR polymorphism status may be associated with AP2A2 expression, and the effect size could be large enough to enable detection of the association by comparing relatively small groups of samples. The goal was to compare AP2A2 transcript levels in 2 groups stratified by the sizes of the largest VNTR region (PCR amplicons)—either relatively large (≥10.8 kb) or small (≤10.1 kb) VNTR. Each group comprised 15 subjects that were matched for age, sex, postmortem interval, and severity of AD-related pathology (Table 3). Fold-changes of detected AP2A2 transcripts (relative to different genes’ transcripts) were calculated based on quantitative PCR results (Fig. 5). There was a trend for the subjects with larger MUC6 VNTR regions to have lower average levels of detected AP2A2 transcripts in comparison to the subjects with smaller MUC6 VNTR regions. This difference was statistically significant when AP2B1 levels were used for normalization (p = 0.014; Fig. 5A), but was only a nonsignificant trend when GAPDH (Fig. 5B) or RPL30 (not shown) were used for normalization.
Sample for eQTL Testing: A Subsample of Subjects was Separated into 2 Groups Based on the Measured PCR Amplicon Referent to the Size of the Largest Detected MUC6 Variable Number Tandem Repeats (VNTR) Region
| Sample Size | n = 15 | n = 15 |
|---|---|---|
| Measured size of MUC6 VNTR (kb), mean | 9.85 | 10.89 |
| Age at death in years, mean | 83.7 | 83.9 |
| Postmortem interval in hours, mean | 3.0 | 3.1 |
| Braak NFT stage (0–VI), n | ||
| 0–II | 5 | 5 |
| III–IV | 2 | 2 |
| V–VI | 8 | 8 |
| Neuritic amyloid plaques (CERAD; 0–3), n | ||
| None | 5 | 5 |
| Probable or Possible (Sparse or Moderate NPs) | 1 | 3 |
| Definite (Frequent NPs) | 9 | 7 |
| Sex, n | ||
| Female | 9 | 9 |
| Male | 6 | 6 |
eQTL, expression quantitative trait loci; NFT, neurofibrillary tangles; CERAD, Consortium to Establish a Registry for AD; PCR, polymerase chain reaction.
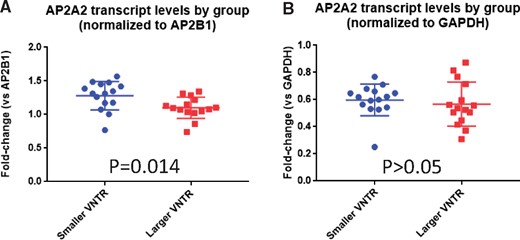
Comparison of AP2A2 transcript levels (a proxy for gene expression) from cerebellum of 2 groups (n = 15 in each group) stratifying on the size of largest MUC6 VNTR region. The 2 groups were matched for age at death, sex, severity of Alzheimer disease neuropathologic changes, and postmortem interval (Table 3). Fold-change of detected AP2A2 transcript relative to a different transcript was calculated based on quantitative PCR results. Regardless of the normalization method, there was a trend for the subjects with larger VNTR regions (red squares) to have lower average levels of detected AP2A2 transcripts in comparison to the individuals with smaller VNTR regions (blue circles). This difference was statistically significant when AP2B1 levels were used for normalization (A), but was only a nonsignificant trend when GAPDH (B) was used for normalization. Comparisons were performed using unpaired 2-tailed Student t-tests.
AP2A2 Immunohistochemistry and Immunofluorescence Analyses
Immunohistochemistry was performed using a commercially available antiserum raised against AP2A2. Brightfield immunohistochemistry showed diffuse strong immunopositivity in neurons in nondemented subjects’ brains. By contrast, in LOAD brains, there was a diminished background AP2A2 staining, whereas cells with a profile of NFTs appeared to be labeled preferentially (Fig. 6). To validate that the antibody recognized AP2A2, Western blots were performed on protein extracts from tissue-cultured HEK 293 cells with and without transfection with the AP2A2 plasmid, and also on extracts from human brains. The predicted ∼104 kDa protein band was labeled on the immunoblots and that signal was increased following AP2A2 plasmid transfection.
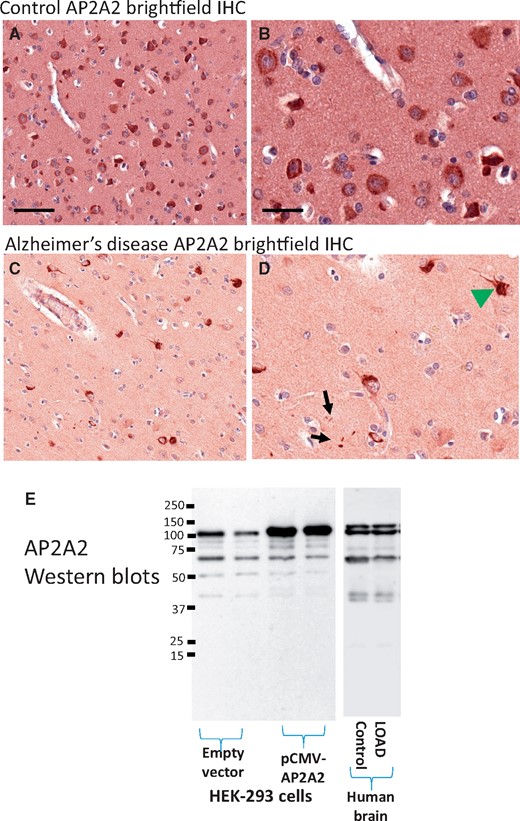
Brightfield immunohistochemical staining of AP2A2 in human brain sections. Shown are representative results from staining of temporal neocortex. Panels (A) and (B) show results from a nondemented aged subject with minimal Alzheimer-type pathology. Panel (A) and (B; higher magnification) show the relatively even, neuronal staining for AP2A2. Panels (C) and (D) show representative results from a demented subject with severe Alzheimer’s disease pathology. Note that the staining pattern of AP2A2 is here reminiscent of neurofibrillary tangles (green arrowhead), as well as some scattered, darkly AP2A2-immunoreactive structures in the neuropil (black arrows). Scale bars: A, C = 200 microns; B, D = 25 microns. Panel (E) shows the results of Western blots using the same AP2A2 antiserum—immunoblots of HEK-293 cell extracts are shown. This antiserum recognizes a prominent band at the predicted (∼104 kDa) size that is augmented by transfection with a pCMV-AP2A2 plasmid. The human brain extracts (shown here are Western blots from the cerebellum of 1 control and 1 LOAD brain) stained a similar banding pattern.
Following the brightfield immunohistochemistry results, immunofluorescence double staining was performed to evaluate AP2A2 and pTau colocalization in 5 LOAD cases (a convenience sample of brains with Braak NFT stage V or VI) from hippocampus and frontal cortex (Brodmann area 9). An example of the AP2A2 and pTau immunofluorescence staining is shown for the epifluorescence microscopy (Fig. 7) and was quantified using confocal microscopy (charts to convey those data are presented in Supplementary Data Fig. S10). Adjacent sections of single antibody-immunostained control slides confirmed the staining specificity. Although AP2A2 immunostaining appeared lower in the cortex compared to the hippocampus, the area of AP2A2+pTau+ was proportional in both the cortex and hippocampus. Across multiple anatomic regions, AP2A2 often was colocalized with pTau in LOAD brains. However, differences in the subcellular expression was apparent, with primarily cytoplasmic AP2A2 staining (as in the brightfield immunohistochemistry), whereas pTau was localized to both the cytoplasm (NFTs) and in dystrophic neurites.
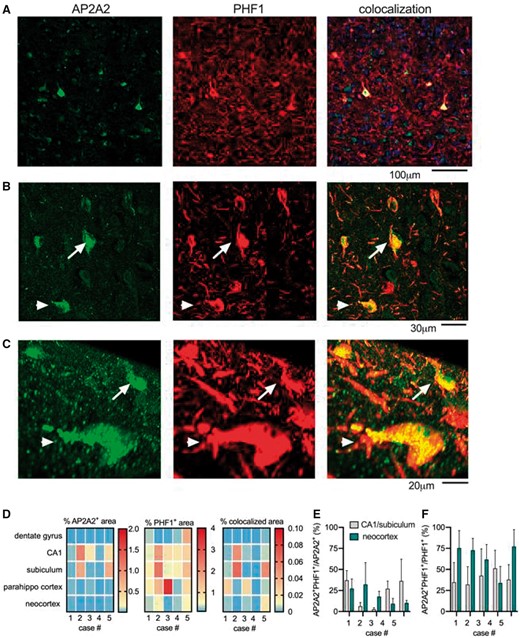
AP2A2 and pTau colocalization, detected using immunofluorescence and digitally quantified in a convenience sample of 5 LOAD cases. (A) A representative example of AP2A2 and pTau (immunostained with PHF1 antibody) staining using epifluorescence microscopy, as well as the HALO software generated digital markup showing the area of staining that was AP2A2+, pTau+, and AP2A2+ pTau+ double positive. In the colocalized markup, the red indicates pTau+, the green indicates AP2A2+, and the yellow indicates AP2A2+pTau+ double positive. (B) and (C) Confocal z-stack images show cells double positive for pTau and AP2A2 at higher magnification. The arrow and arrowhead indicate the same cells (B), shown in the orthogonal projection images in (C). (D) Panel shows the percentage of the tissue in each of the regions of interest that was positive staining. The number of AP2A2+pTau+ double positive cells in relation to the number of AP2A2+ is shown in (E), and in relation to the pTau+ cells in (F), as quantified by confocal microscopy in the hippocampus and neocortex. Data are plotted as mean ± SD for the 5–10 z-stacks included for each region and for each slide.
To determine the extent of colocalization, that is, how many of the same cells were double positive (AP2A2+pTau+), confocal z-stacks were captured in hippocampal CA1/subiculum and neocortex. For the colocalization analysis, a total of 1514 different cells were evaluated. When normalized to the total number of AP2A2+ cells in each z-stack, <50% were AP2A2+pTau+ double positive (Fig. 7D). In contrast, when normalized to the total number of pTau+ cells in each z-stack, the number of cells that were AP2A2+pTau+ double positive was mostly >50%, particularly in the neocortex (Fig. 7E). Although the majority of the AP2A2 immunoreactivity was diffuse cytoplasmic staining (often colocalized with pTau), we also observed brightly AP2A2-immunoreactive structures that were immunonegative for pTau (Supplementary Data Fig. S11).
To assess the specificity of the AP2A2 colocalization with pTau pathology in LOAD, we quantified the extent of AP2A2 colocalization with phospho-TDP-43 in cases with comorbid LOAD and LATE-NC, and with subcortical (caudate nucleus) pTau proteinopathy (mostly glial tangles) in cases with PSP (Fig. 8). The extent of detected AP2A2 and phospho-TDP-43 colocalization was relatively minimal (Supplementary Data Fig. S12). Similarly, and in contrast to the observations in LOAD brains, there was only slight colocalization of AP2A2 and pTau proteinopathy in caudate nucleus of PSP brains (Supplementary Data Fig. S13).
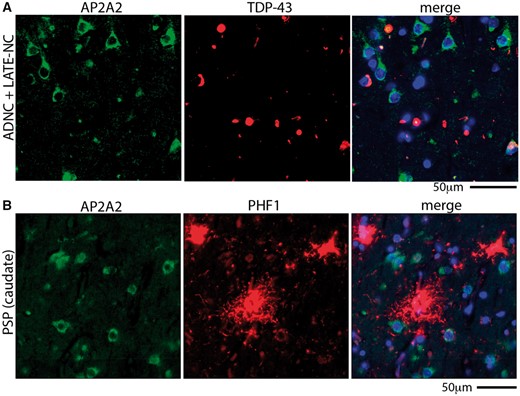
Unlike in cases with LOAD pathology, AP2A2 does not colocalize extensively with phospho-TDP-43 in brains with limbic-predominant age-related TDP-43 proteinopathy neuropathologic changes (LATE-NC), nor with pTau in progressive supranuclear palsy (PSP) brains. (A) A representative example of AP2A2 and phospho-TDP-43 staining using epifluorescence microscopy shows the lack of colocalization of AP2A2 with phospho-TDP-43 in a brain with both AD neuropathologic changes (ADNC) and LATE-NC. (B) AP2A2 was also not colocalized with pTau (immunostained with antibody PHF1) in the caudate nucleus of subjects with autopsy-proven PSP. Quantitative analyses of these results are shown in Supplementary Data Figures S12 and S13.
Tissue Culture Experiments to Test Tau-AP2A2 Coimmunoprecipitation
Experiments in cultured HeLa cells were performed to test whether Tau and AP2A2 proteins can be coimmunoprecipitated in this nonneuronal tumor cell line (Fig. 9 and Supplementary Data Fig. S14). Western-blot analysis showed that a band with the predicted size of the AP2A2 protein (∼104 kDa) was present without transfection as expected. That signal was augmented in the lysate and in immunoprecipitations where Flag-AP2A2 plasmids were transfected, indicating that the Flag-AP2A2 transfection was successful. Further, anti-Flag M2 beads pulled down the Flag-tagged AP2A2. To examine whether AP2A2 can be coimmunoprecipitated with Tau, Flag-AP2A2, and Tau expressing plasmids were cotransfected. Tau immunoblots confirmed that the Tau plasmid transfection was successful with or without the cotransfected Flag-AP2A2 plasmid. Importantly, endogenous AP2B1, a known binding partner of AP2A2, was coimmunoprecipitated with AP2A2. By contrast, there was no augmented signal of Tau protein in the M2-immunoprecipitation following AP2A2 and Tau cotransfection, indicating that (unlike AP2A2 and AP2B1) AP2A2 and Tau proteins were not coimmunoprecipitated.
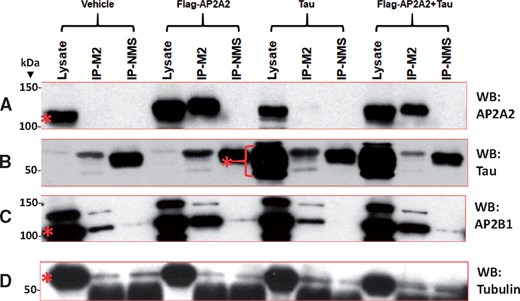
Western blots show results of experiments in cultured cells testing whether AP2A2 and Tau proteins can be coimmunoprecipitated. Flag-AP2A2 and Tau expressing plasmids were transfected into cultured HeLa cells, separately and together. The lysates, Anti-Flag M2 coimmunoprecipitation (Co-IP), and nonimmunized mouse serum (NMS) controls were immunoblotted for AP2A2 (A), Tau (B), AP2B1 (C), and tubulin as a control (D). Molecular weights (kDa) are indicated on the left of the blots. A band labeled by the AP2A2 antibody (∼104 kDa) was present without transfection, and that signal was augmented in the lysate and in IPs where Flag-AP2A2 plasmids were transfected, indicating that Flag-AP2A2 transfection was successful. Anti-Flag M2 beads pulled down the Flag-tagged AP2A2. There were no augmented signals of Tau protein in the M2-IP product of the AP2A2 and Tau cotransfection when probed with Tau antibody DA9, indicating that AP2A2 and Tau proteins were not coimmunoprecipitated. Bands at ∼55 kDa (near to Tau) in the NMS and M2-IP lanes were likely immunoglobulin protein and were present in all the immunoblots. As a positive control, endogenous AP2B1, a known binding partner of AP2A2 with the same molecular weight of ∼104 kDa, was Co-IP’d with AP2A2. Gel portions where the proteins were predicted to be present, according to their known molecular weights, are shown with a red asterisk for each protein. Complete Western blots are shown in Supplementary Data Figure S14.
DISCUSSION
Following in silico analyses of WES data, we focused on a highly polymorphic VNTR region within the MUC6 gene. In autopsied subjects, the size of the VNTR region (determined by PCR) was associated with the severity of LOAD pTau pathology in neocortical regions. The main finding was confirmed in a separate Replication cohort. Polymorphism in the same VNTR region was also associated with AP2A2 expression in human brain. In immunofluorescence experiments, AP2A2 protein was colocalized with NFTs in LOAD. Together, these data indicate a genomic region with sequence variation relevant to neocortical neurofibrillary degeneration—a pathologic feature that is, in turn, strongly associated with cognitive impairment (5).
The term VNTR describes end-to-end iterations of repetitive genomic sequences ≥6 bp in length (56, 57). The number of repeated sequence units in a given locus is inherited in the germline and often differs from individual to individual (56, 58). VNTRs can be transcriptional regulators for nearby genes (59), and the large versions of some tandemly repeated sequences are known to be associated with human diseases (55). However, VNTR regions have been at least partly omitted from high-throughput genomic research for technical reasons, and therefore not included in many genotype-phenotype correlation analyses (22, 58).
The MUC6 VNTR region has been studied by other investigators (60–65). Most human genome VNTR regions contain repeated sequences that are shorter (usually 10–60 bp) than those in the MUC6 gene (57): Each of the MUC6 gene tandemly repeated polymorphic sequences is ∼507 bp, and these unit repeats are composed of shorter repetitive subunits (56, 60). The number of ∼507 bp repeat sequences in the MUC6 VNTR region of human genomes has been suggested to range between 15 and 26 (63). No other known human tandem repeat sequence is highly similar to the MUC6 VNTR region. In the mouse genome, a tandem repeat region is present in the same MUC6 exon and near AP2A2 (66), but the orthologous sequences are quite divergent between mice and humans.
Unfortunately, the MUC6 VNTR region is extremely difficult to sequence, for technical reasons, related to the size, number, and interindividual differences of the tandem repeats (60). There has not been a full-length MUC6 transcript sequence reported to date (incomplete cDNA sequences have been described [62, 65, 67–69]). The technical difficulty in sequencing is also a formidable challenge for detailed analysis of DNA haplotypes using most extant methods (56, 60). For now, we emphasize that there remains uncertainty about the disposition of the human MUC6 VNTR region: The full extent of polymorphism and the complement of repeats are incompletely characterized.
The MUC6 gene is a member of the mucin gene family. An interesting feature of this gene family is that tandem repeats reside in exons, and therefore they are transcribed and translated (67). The repetitive polypeptide domains help constitute the “main components of mucus” and, when glycosylated, these amino acid motifs provide a basis for the “gel forming” characteristics of mucin proteins (67). MUC6 is expressed preferentially in epithelial tissues, particularly in the gastrointestinal tract (68, 70–73). Hence, a major focus in prior work has been on how the MUC6 VNTR polymorphism is associated with risk for gastrointestinal diseases—ulcers, gut infections, and stomach or intestinal cancers (60, 61, 74–78). However, this unique tandem repeat region may have broader impact. The MUC6 VNTR polymorphism may affect 2 organ systems—brain and digestive tract—through influencing the expression of at least 2 separate genes.
In contrast to MUC6, AP2A2 is expressed robustly in many human tissues, including in brain (Supplementary Data Fig. S5). Few prior studies have focused on the AP2A2 polypeptide or on the regulation of its expression, especially in the nervous system. AP2A2 is a component of an evolutionarily conserved adaptor protein complex, AP-2 (79, 80). Adaptor protein complexes reside on the surface of vesicles and interact with proteins and lipids to facilitate various membrane traffic pathways (81, 82). More specifically, AP-2 is a 5-protein multimer involved in clathrin-dependent endocytosis and fusion with early endosomes (79, 81, 83). We note that variants of several other clathrin-coated vesicle-related genes (PICALM and BIN1) have been associated with AD risk previously (84–86).
An AP2A2 SNP (rs10751667) was previously identified as a “suggestive” locus in a meta-analytic LOAD GWAS by Lambert et al (8)—the SNP status was associated with LOAD risk with nominal p = 6.3 × 10⁻⁷, but was not genome-wide significant after correcting for multiple testing. In a separate study, the same SNP was associated with a subtype of mild cognitive impairment (87). This SNP (rs10751667) is within 75 kilobases of the MUC6 VNTR region and may be an expression quantitative trait locus (eQTL) for AP2A2 (data not shown). Another recent GWAS reported a different AP2A2 SNP, rs10794342 (in LD with rs10751667), again with suggestive nominal (p = 4 × 10⁻⁶) linkage to LOAD risk (88). The different published GWAS had nonidentical but overlapping samples. To be clear, the prior studies do not show definitive proof of AP2A2 as a LOAD risk locus. We hypothesize that prior GWAS were unable to assess the MUC6 VNTR polymorphism, and prior analyses of ADSP WES data for LOAD-linked genes (31, 89, 90) filtered out the data from this poorly annotated genomic region. Indeed, previous work on ADSP data found that many “dark and camouflaged” regions were functionally removed from prior analyses (22).
Although it was serendipitous that genetic variation in the MUC6 VNTR region was recognized in exome sequencing data, the main foci of the current study were on hypothesis-based experiments performed after the in silico genome-wide tests. Among research subjects with genetic and autopsy data available, the size of the MUC6 VNTR region was associated with pTau pathologic burden in neocortex. Digital neuropathologic technologies, including slide scanners and image analysis software, were integral to our phenotyping strategy. These resources allowed the evaluation of quantitative pathologic features of many individually analyzed slides—1839 slides were analyzed separately for Table 2 data. Digital pathology is increasingly being utilized in dementia research studies (91, 92), although there are potential pitfalls as we have discussed (93, 94). Here, we were able to uncover a phenomenon that may have been impossible to evaluate if we had only used semiquantitative (“stage”-based) pathologic severity parameters.
The hypothesis that AP2A2 dysregulation is associated with pTau proteinopathy in LOAD was also supported by other observations. AP2A2 protein was colocalized with NFTs in LOAD and that colocalization was somewhat specific, since AP2A2 was not colocalized either with subcortical pTau proteinopathy in PSP (in the caudate nucleus), nor with TDP-43 proteinopathy in LATE-NC. However, in tissue culture experiments, we found no evidence that Tau and AP2A2 proteins were coimmunoprecipitated. These results suggest that the AP2A2 and pTau proteins detected via immunohistochemistry signal parallel or synergistic process(es), rather than reflecting a direct obligate interaction between AP2A2 and Tau proteins. We note that AP2A2 protein may interact directly with Tau isoforms, oligomers, and/or filaments that were not present in this clonal population of nonneuronal cells. Further, we did not test systematically the hypothesis that AP2A2 is associated non-LOAD tauopathies, or the PSP tauopathy present in other brain regions, such as the brainstem. These knowledge gaps indicate potentially worthy areas for future studies.
In addition to being associated with increased pTau burden in LOAD, larger MUC6 VNTR regions were also associated with decreased AP2A2 expression in human brain tissue, when the AP2A2 data were normalized on the levels of detected AP2B1. AP2B1 is, like AP2A2, a component polypeptide of the multimeric AP-2 adaptor complex. The sample sizes (n = 15 per genotype group) were small for an eQTL study (95). However, these experiments provided preliminary evidence in support of the hypothesis that the tandemly arranged repeats in the immediate 3′ region of AP2A2 may act as a transcriptional silencer or may interfere with a transcriptional enhancer.
There are some limitations of the current work. The WES analyses highlighted genetic variants from an incompletely annotated genomic region (Fig. 2 and Supplementary Data Fig. S7). Technical limitations in sequencing made it practically impossible to directly sequence MUC6 VNTR haplotypes, so the exact sequences of the MUC6 VNTR regions for each case included in the study are not known. We found slightly shorter MUC6 VNTR regions than some prior work (77, 78), which implies that our initial assays underestimated the size of the VNTR regions. Although the PCR assay has utility, there also are potential technical drawbacks since the smaller allele may be preferentially amplified (96). Finally, it is theoretically possible that the VNTR polymorphism causes altered processing of MUC6 and that this gene (rather than AP2A2) has an impact on brain pTau pathology.
Although the underlying mechanisms are mostly unknown, credible inferences and testable hypotheses can be generated based on these results. For example, the neuroanatomical distribution of AP2A2 expression may help explain the differential vulnerability to tauopathy in different brain regions and may contribute to the existence of different pathologic subtypes of LOAD, for example, limbic-sparing subtype of LOAD (97, 98). We also speculate that the MUC6 VNTR polymorphism is a possible reason why some individuals (those with more MUC6 VNTR repeats) may be relatively vulnerable to tauopathy with a given burden of Aβ plaques.
ACKNOWLEDGMENTS
We are deeply grateful to all of the study participants, clinical workers, and researchers who made this study possible. Thanks to Drs Peter Davies, Edward Lee, and Virginia Lee for providing antibodies. The Genotype-Tissue Expression (GTEx) Project was supported by the Common Fund of the Office of the Director of the NIH, and by NCI, NHGRI, NHLBI, NIDA, NIMH, and NINDS. The ADSP is composed of 2 AD genetics consortia and 3 National Human Genome Research Institute (NHGRI) funded Large Scale Sequencing and Analysis Centers (LSAC). The 2 AD genetics consortia are the ADGC funded by NIA (U01 AG032984), and CHARGE consortium funded by NIA (R01 AG033193), the National Heart, Lung, and Blood Institute (NHLBI), other NIH institutes and other foreign governmental and nongovernmental organizations. The Discovery Phase analysis of sequence data is supported through UF1AG047133 (to Drs Schellenberg, Farrer, Pericak-Vance, Mayeux, and Haines); U01AG049505 to Dr Seshadri; U01AG049506 to Dr Boerwinkle; U01AG049507 to Dr Wijsman; and U01AG049508 to Dr Goate and the Discovery Extension Phase analysis is supported through U01AG052411 to Dr Goate, U01AG052410 to Dr Pericak-Vance, and U01 AG052409 to Drs Seshadri and Fornage. Data generation and harmonization in the Follow-up Phases is supported by U54AG052427 (to Drs Schellenberg and Wang). The ADGC cohorts include: Adult Changes in Thought (ACT), the ADCs, the Chicago Health and Aging Project (CHAP), the Memory and Aging Project (MAP), Mayo Clinic (MAYO), Mayo Parkinson’s Disease controls, University of Miami, the Multi-Institutional Research in Alzheimer’s Genetic Epidemiology Study (MIRAGE), the National Cell Repository for AD (NCRAD), the NIA Late Onset AD Family Study (NIA-LOAD), the Religious Orders Study (ROS), the Texas Alzheimer’s Research and Care Consortium (TARC), Vanderbilt University/Case Western Reserve University (VAN/CWRU), the Washington Heights-Inwood Columbia Aging Project (WHICAP) and the Washington University Sequencing Project (WUSP), the Columbia University Hispanic-Estudio Familiar de Influencia Genetica de Alzheimer (EFIGA), the University of Toronto (UT), and Genetic Differences (GD). The CHARGE cohorts are supported in part by NHLBI infrastructure grant HL105756 (Psaty), RC2HL102419 (Boerwinkle), and the neurology working group is supported by the National Institute on Aging (NIA) R01 grant AG033193. The CHARGE cohorts participating in the ADSP include the following: Austrian Stroke Prevention Study (ASPS), ASPS-Family study, and the Prospective Dementia Registry-Austria (ASPS/PRODEM-Aus), the Atherosclerosis Risk in Communities (ARIC) Study, the Cardiovascular Health Study (CHS), the Erasmus Rucphen Family Study (ERF), the Framingham Heart Study (FHS), and the Rotterdam Study (RS). ASPS is funded by the Austrian Science Fond (FWF) grant number P20545-P05 and P13180 and the Medical University of Graz. The ASPS-Fam is funded by the Austrian Science Fund (FWF) project I904), the EU Joint Programme—Neurodegenerative Disease Research (JPND) in frame of the BRIDGET project (Austria, Ministry of Science) and the Medical University of Graz and the Steiermärkische Krankenanstalten Gesellschaft. PRODEM-Austria is supported by the Austrian Research Promotion agency (FFG) (Project No. 827462) and by the Austrian National Bank (Anniversary Fund, project 15435). ARIC research is carried out as a collaborative study supported by NHLBI contracts (HHSN268201100005C, HHSN268201100006C, HHSN268201100007C, HHSN268201100008C, HHSN268201100009C, HHSN268201100010C, HHSN268201100011C, and HHSN268201100012C). Neurocognitive data in ARIC are collected by U01 2U01HL096812, 2U01HL096814, 2U01HL096899, 2U01HL096902, 2U01HL096917 from the NIH (NHLBI, NINDS, NIA, and NIDCD), and with previous brain MRI examinations funded by R01-HL70825 from the NHLBI. CHS research was supported by contracts HHSN268201200036C, HHSN268200800007C, N01HC55222, N01HC85079, N01HC85080, N01HC85081, N01HC85082, N01HC85083, N01HC85086, and grants U01HL080295 and U01HL130114 from the NHLBI with additional contribution from the National Institute of Neurological Disorders and Stroke (NINDS). Additional support was provided by R01AG023629, R01AG15928, and R01AG20098 from the NIA. FHS research is supported by NHLBI contracts N01-HC-25195 and HHSN268201500001I. This study was also supported by additional grants from the NIA (R01s AG054076, AG049607, and AG033040) and NINDS (R01 NS017950). The ERF study as a part of EUROSPAN (European Special Populations Research Network) was supported by European Commission FP6 STRP grant number 018947 (LSHG-CT-2006-01947) and also received funding from the European Community’s Seventh Framework Programme (FP7/2007-2013)/grant agreement HEALTH-F4-2007-201413 by the European Commission under the programme “Quality of Life and Management of the Living Resources” of 5th Framework Programme (no. QLG2-CT-2002-01254). High-throughput analysis of the ERF data was supported by a joint grant from the Netherlands Organization for Scientific Research and the Russian Foundation for Basic Research (NWO-RFBR 047.017.043). The Rotterdam Study is funded by Erasmus Medical Center and Erasmus University, Rotterdam, the Netherlands Organization for Health Research and Development (ZonMw), the Research Institute for Diseases in the Elderly (RIDE), the Ministry of Education, Culture and Science, the Ministry for Health, Welfare and Sports, the European Commission (DG XII), and the municipality of Rotterdam. Genetic data sets are also supported by the Netherlands Organization of Scientific Research NWO Investments (175.010.2005.011, 911-03-012), the Genetic Laboratory of the Department of Internal Medicine, Erasmus MC, the Research Institute for Diseases in the Elderly (014-93-015; RIDE2), and the Netherlands Genomics Initiative (NGI)/Netherlands Organization for Scientific Research (NWO) Netherlands Consortium for Healthy Aging (NCHA), project 050-060-810. All studies are grateful to their participants, faculty, and staff. The content of these manuscripts is solely the responsibility of the authors and does not necessarily represent the official views of the NIH or the U.S. Department of Health and Human Services. The 4 LSACs are: The Human Genome Sequencing Center at the Baylor College of Medicine (U54 HG003273), the Broad Institute Genome Center (U54HG003067), The American Genome Center at the Uniformed Services University of the Health Sciences (U01AG057659), and the Washington University Genome Institute (U54HG003079). Biological samples and associated phenotypic data used in primary data analyses were stored at Study Investigators institutions, and at the National Cell Repository for AD (NCRAD, U24AG021886) at Indiana University funded by NIA. Associated Phenotypic Data used in primary and secondary data analyses were provided by Study Investigators, the NIA funded ADCs, and the National Alzheimer’s Coordinating Center (NACC, U01AG016976) and the National Institute on Aging Genetics of AD Data Storage Site (NIAGADS, U24AG041689) at the University of Pennsylvania, funded by NIA, and at the Database for Genotypes and Phenotypes (dbGaP) funded by NIH. This research was supported in part by the Intramural Research Program of the National Institutes of health, National Library of Medicine. Contributors to the Genetic Analysis Data included Study Investigators on projects that were individually funded by NIA, and other NIH institutes, and by private US organizations, or foreign governmental or nongovernmental organizations.
REFERENCES
Author notes
Funding included grants P30 AG028383, R01 AG057187, R01 AG042475, and U01 AG016976 from the National Institute on Aging (NIA)/National Institutes of Health (NIH). Please see the additional Acknowledgment section at the end of the Discussion section.
The authors have no duality or conflicts of interest to declare.
Supplementary Data can be found at academic.oup.com/jnen.
